Hello readers, a few weeks back we started with the series to make technical analysis easy for beginners. In our first part of the series e discussed What is technical analysis? Technical analysis is one way to analyze potential investments to determine if or when to buy or sell. And, today we are going to read about What is Japanese candlestick charting technique? how these candlestick patterns enable traders to understand the market? and how to understand these Japanese candlestick charting techniques? everything is covered in today's blog. So, let's begin with what is Japanese candlestick charting technique? And, the importance of candlestick patterns in technical analysis.
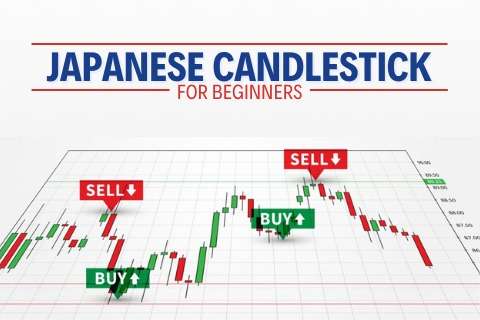
What is the Japanese candlestick charting technique?
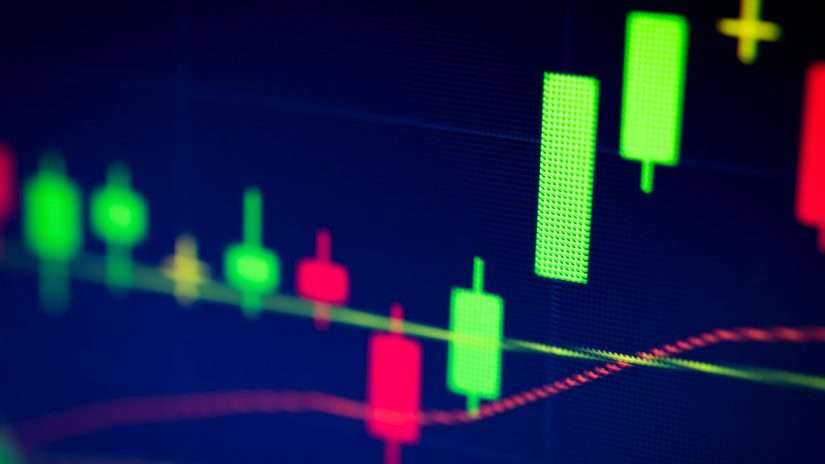
The Japanese began using technical analysis to trade rice in the 17th century. To create a candlestick chart, you must have a data set that contains open, high, low, and close values for each time period you want to display. The red or green portion of the candlestick is called “the body” (also referred to as “the real body”). The long thin lines above and below the body represent the high/low range and are called “shadows” (also referred to as “wicks” and “tails”). The high is marked by the top of the upper shadow and the low by the bottom of the lower shadow. If the stock closes higher than its opening price, a hollow candlestick is drawn with the bottom of the body representing the opening price and the top of the body representing the closing price. If the stock closes lower than its opening price, a filled candlestick is drawn with the top of the body representing the opening price and the bottom of the body representing the closing price.
Compared to traditional bar charts, many traders consider candlestick charts more visually appealing and easier to interpret. Each candlestick provides a simple, visually appealing picture of price action; a trader can instantly compare the relationship between the open and close as well as the high and low. The relationship between the open and close is considered vital information and forms the essence of candlesticks. Green candlesticks, where the close is greater than the open, indicate buying pressure. Red candlesticks, where the close is less than the open, indicate selling pressure.
Candlestick vs. Bar Charts
Just above and below the real body are the "shadows" or "wicks." The shadows show the high and low prices of that day's trading. If the upper shadow on a down candle is short, it indicates that the open that day was near the high of the day. A short upper shadow on up-day dictates that the close was near the high. The relationship between the days open, high, low, and close determines the look of the daily candlestick. Real bodies can be long or short and black or white. Shadows can be long or short. Bar charts and candlestick charts show the same information, just in a different way. Candlestick charts are more visual, due to the color-coding of the price bars and thicker real bodies, which are better at highlighting the difference between the open and the close.
Understanding Candlestick Patterns
Once you understand what each candle is indicating, you can start looking for trading opportunities based on candlestick patterns, Patterns are separated into bullish and bearish. Bullish patterns indicate that the price is likely to rise, while bearish patterns indicate that the price is likely to fall.
The following are some of the commonly seen patterns.
Engulfing patterns:
- Bearish Engulfing Pattern:- ?A bearish engulfing pattern develops in an uptrend when sellers trap the buyers. This action is reflected by a long red real body engulfing a small green real body. The pattern indicates that sellers are back in control and that the price could continue to decline.
- Bullish Engulfing Pattern:- ?An engulfing pattern on the bullish side of the market takes place when buyers push out sellers. This is reflected in the chart by a long green real body engulfing a small red real body. With bulls in control, the price could head higher.
Doji:
Doji represents an important type of candlestick, providing information both on their own and as components of several important patterns. Ideally, but not necessarily, the open and close should be equal. While a doji with an equal open and close would be considered more robust, it is more important to capture the essence of the candlestick. Doji conveys a sense of indecision or tug-of-war between buyers and sellers.. Doji is neutral patterns. Any bullish or bearish bias is based on preceding price action and future confirmation.
Different types of Doji includes:-
- Long-Legged Doji: Long-legged doji have long upper and lower shadows that are almost equal in length. These doji reflect a great amount of indecision in the market.
- Dragonfly and Gravestone Doji:- Dragonfly doji form when the open, high, and close are equal and the low creates a long lower shadow. The resulting candlestick looks like a “T” due to the lack of an upper shadow. Dragonfly Doji indicates that sellers dominated trading and drove prices lower during the session. By the end of the session, buyers resurfaced and pushed prices back to the opening level and the session high.
- Gravestone Doji:- Gravestone Doji forms when the open, low, and close are equal and the high creates a long upper shadow. The resulting candlestick looks like an upside-down “T” due to the lack of a lower shadow. Gravestone Doji indicates that buyers dominated trading and drove prices higher during the session. However, by the end of the session, sellers resurfaced and pushed prices back to the opening level and the session low.
Star Pattern:-
A candlestick that gaps away from the previous candlestick is said to be in star formation. The first candlestick usually has a large real body, but not always, and the second candlestick in star position has a small real body. Depending on the previous candlestick, the star position candlestick gaps up or down and appears isolated from previous price action.
- Morning star:- This pattern is formed at the start of a bullish trend or the end of a bearish trend. This pattern consists of 3 candles. The first is a strong red candle followed by a star and the third is a strong bullish candle that fills the gap created by the star.
- Evening star:- The evening star is just the opposite of the morning star pattern. This pattern is formed at the end of a strong bullish phase and marks the start of the bearish move. This pattern too consists of three candles, the first is a strong green candle followed by a star that gaps up and then ends the session in the red and the last candle is a strong bearish candle.
Harami pattern:-
A candlestick that forms within the real body of the previous candlestick is in Harami position. Harami means pregnant in Japanese; appropriately, the second candlestick is nestled inside the first. The first candlestick usually has a large real body and the second a smaller real body than the first. Harami candle patterns are also called inside candle patterns.
The Bottom Line:-
As Japanese rice traders discovered centuries ago, investors' emotions surrounding the trading of an asset have a major impact on that asset's movement. Candlesticks help traders to gauge the emotions surrounding a stock, or other assets, helping them make better predictions about where that stock might be headed.
So, That is it about our 2nd part of the series of Technical Analysis 101. If you are willing to invest in stocks with the most trusted stockbroker in Mumbai then click here to claim your Demat Account. To explore other investment opportunities Click here.